

Earlier in the year we shared a piece on using causal mapping on football: separating what pundits talk about from what actually drives results. A few people asked the obvious question. That's fun, but what's it got to do with my business? Fair. So here's the same problem, somewhere it costs real money.
Let's take a (fictional) mid/upscale hotel group. They've had a good quarter: forward bookings are ahead of plan, revenue is up, and the commercial team meets to work out what worked so they can do more of it.
By the end of the hour, three teams have each claimed the win:
- Pricing says it was the new rate strategy. The numbers moved right after they changed approach.
- Marketing says it was them. They retuned the campaign and the platform's been delivering ever since.
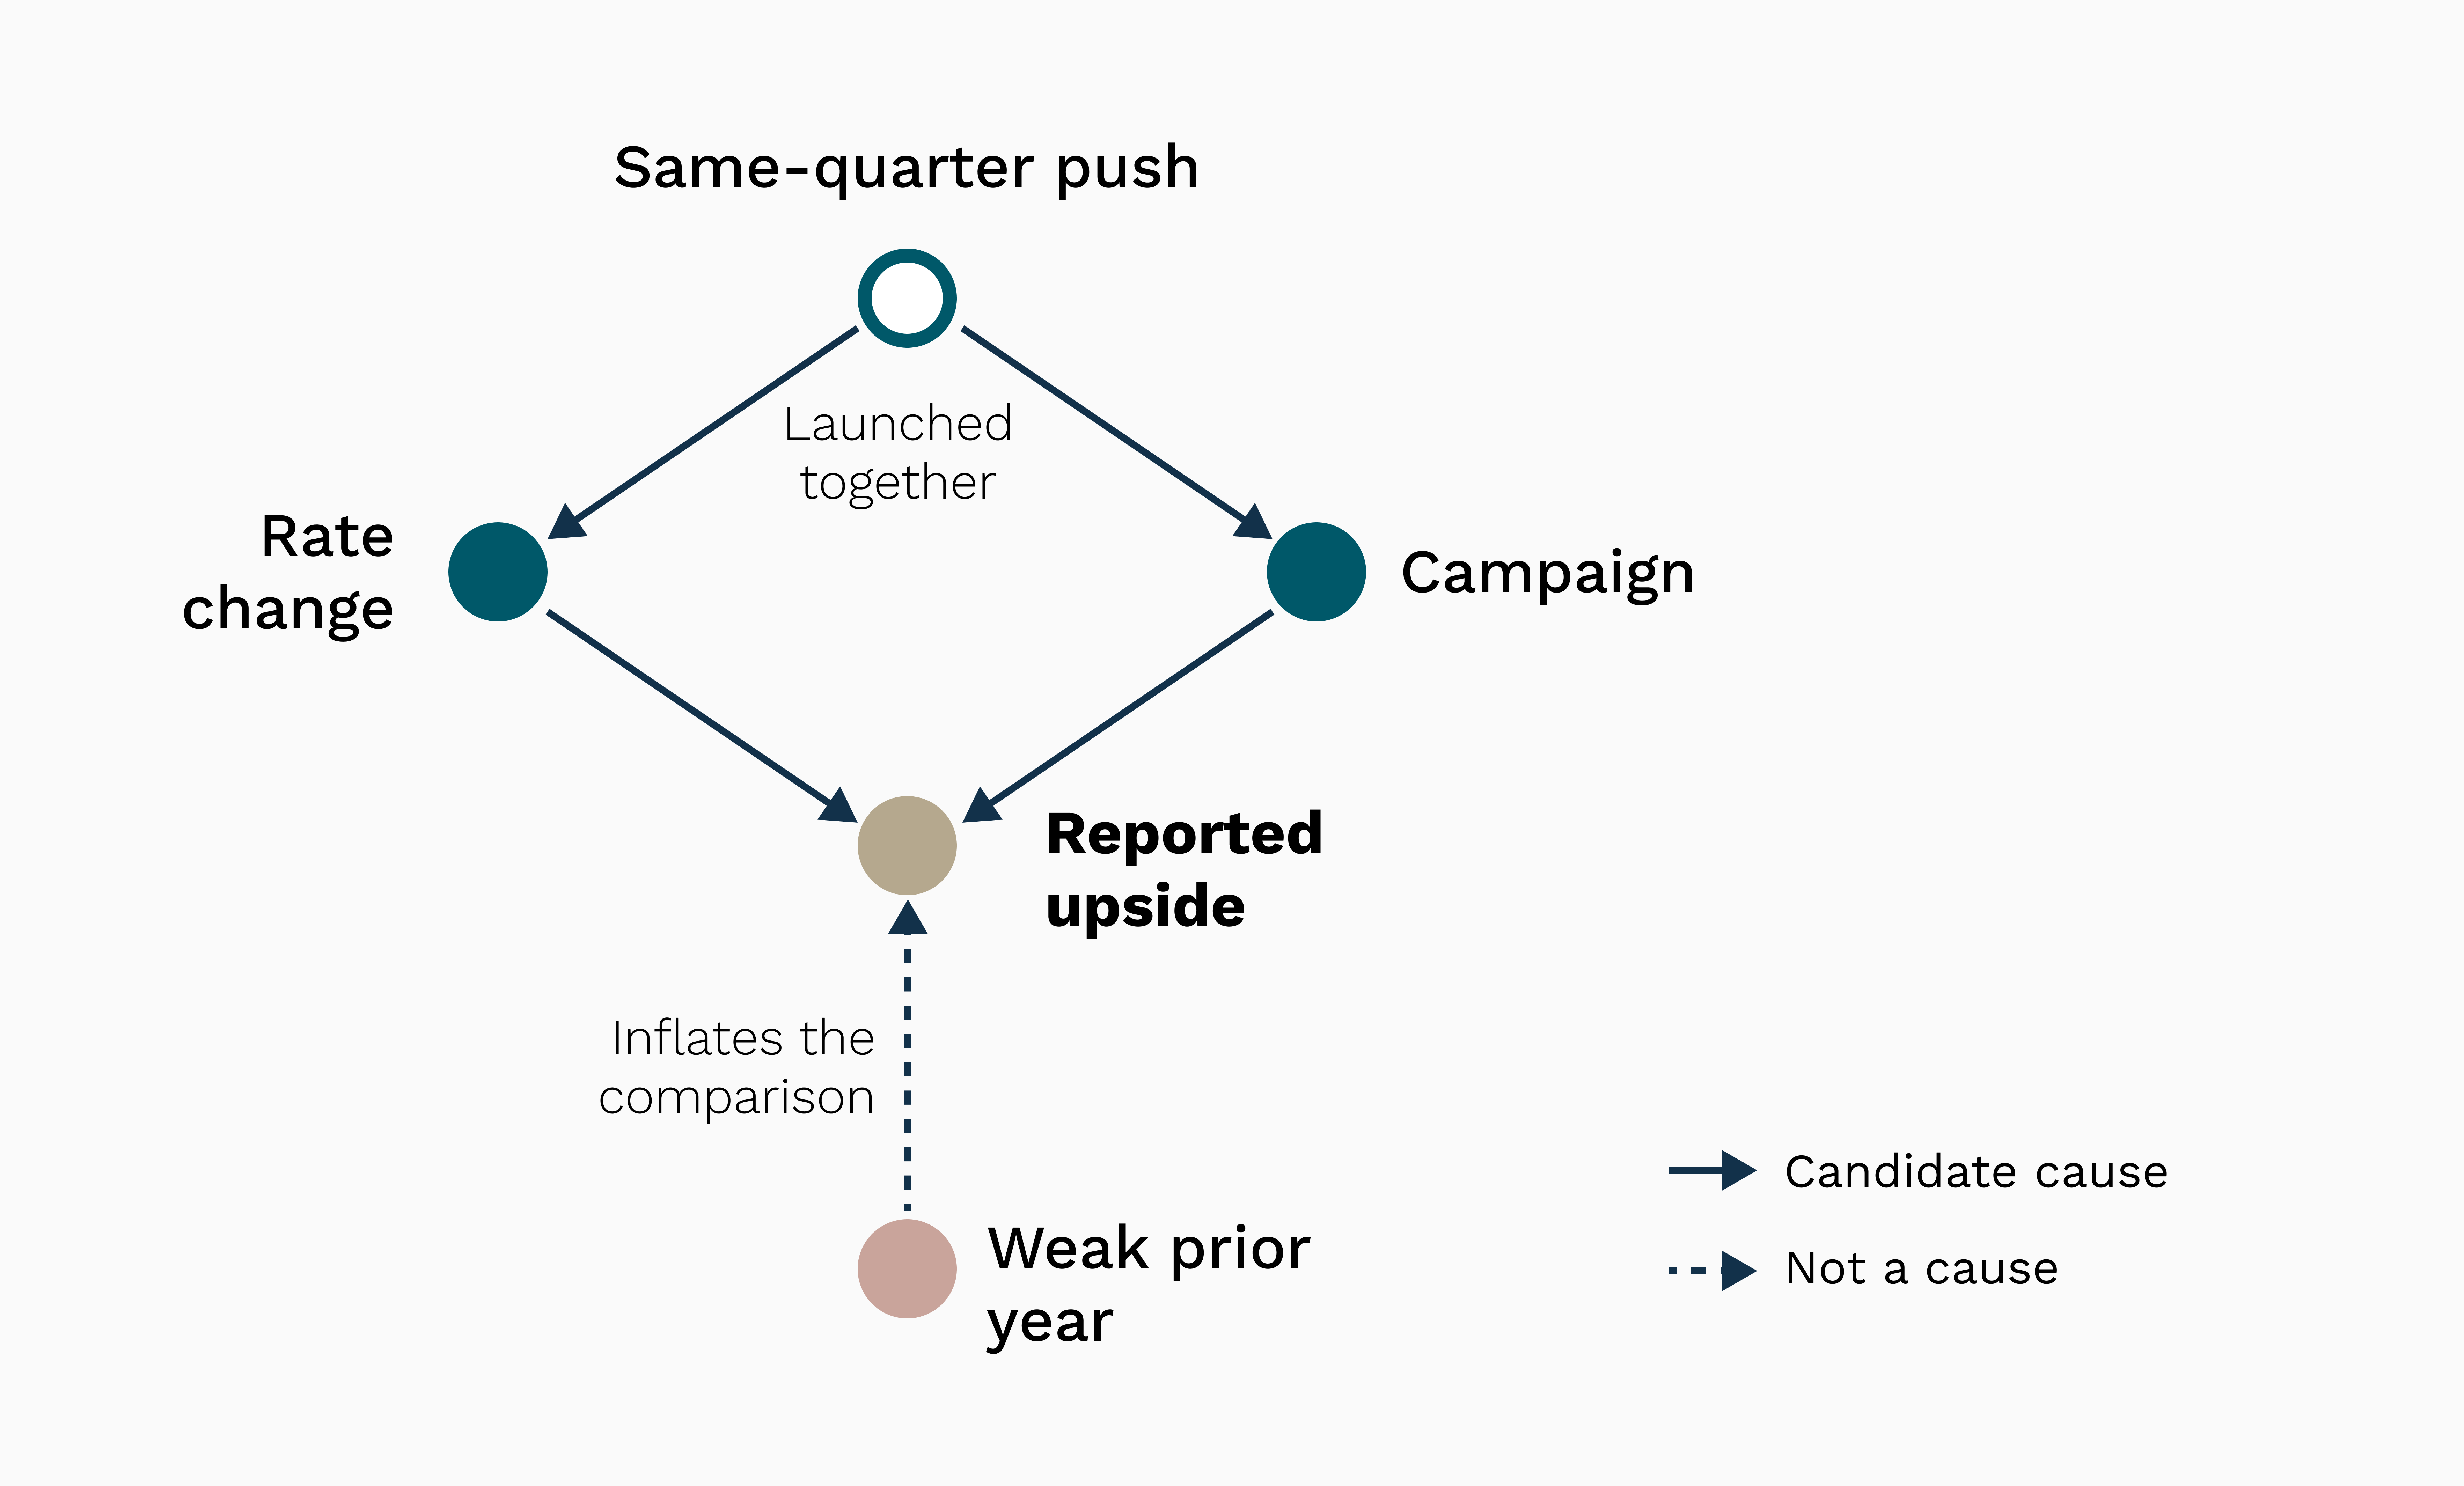
- And someone quietly points out a third thing: last year's quarter was weak, so the comparison was always going to look good this time around.
All three are plausible. Each has a nice chart to back themselves. And here's the problem: add up what each team is claiming and it comes to more than the actual gain. They can't all be right. But the room has no way to tell who is.
Three claims, three different bets
This matters because what you do next depends entirely on who actually drove it.
If pricing did it, you lean into the rate strategy and roll it out wider.
If marketing did it, you give them more budget and scale the campaign.
If it was just the weak comparison, you do nothing different, because there's nothing to repeat. The upside wasn't a lever anyone pulled. It was the base. And maybe you want to think about your metrics to strip out this effect.
So the claims aren't only a fight over credit. Each one points you at a different decision for next quarter. Scale pricing, fund marketing, or hold steady. Back the wrong one and you pour money into a lever that did nothing, and bank a win that was never going to repeat.
Why nobody in the room can actually tell
The honest answer is that all three probably happened at once.
Pricing changed its approach in the same quarter marketing retuned the campaign, while you were lapping a weak base. Three things moving together, landing on one revenue line. You can't read three overlapping causes off a single chart. The line went up. It doesn't come with a breakdown of who moved it.
Each claim also has a trap of its own. The marketing one is a measurement trap: the platform reports the conversions it thinks it drove, but a platform claiming credit isn't the same as a platform causing the result. The pricing one is the in-house version of that, the team that changed something assumes the change is why, because the timing fits. And the base effect is the sneakiest, because it isn't really a cause at all, just last year's weakness flattering this year's numbers. Everyone gets to feel good, and nobody actually did anything.
Same problem, simpler pitch
In our football series we saw how, across thousands of matches, the factors pundits talk about most; form, weather, travel, fixture congestion, barely moved results. The ones they rarely mention, the wage bill gap and the crowd, did most of the work. Confident and correct turned out to be different things.
Our hotel meeting is the same gap. The three claims on the table are the easy ones to reach for, the levers someone owns and can point at. The real driver might be one of them, a bit of all of them, or something nobody put on a slide at all: a shift in channel mix, a change in who's booking, a cohort behaving differently from last year's. None of it makes it into the room, because nobody can measure it.
What telling them apart would take
You can start to resolve this without a model. The trick is to stop treating the three claims as a multiple-choice question with one right answer. The technique behind that is causal mapping, the same approach we used on the football data. It's just a way of laying out what you think drives what, so you can see where two claims are tangled together and what would tell them apart.
The first move is to notice they're tangled. If the rate change and the campaign retune landed in the same quarter, you can't credit either without separating them. That's called confounding, and it's why the chart can't settle the argument.
The second is to ask what evidence would actually distinguish them. The base effect is testable: look at absolute booking pace against a normal year, not just the year-on-year line. The pricing claim is testable: did the gain show up specifically where the new rates applied, or everywhere, which would mean something else drove it. The marketing claim is testable: hold out a market or a spend level and see whether the upside holds without the platform marking its own homework.
None of that is exotic. It's the difference between a room that argues about who deserves the credit, and a room that asks what would have to be true for each claim to hold.
And that's what a causal map gives you. It won't hand you the answer, but it shows you which claims are tangled together and which ones you could actually test.
The question to leave with
Next time the numbers are good and three teams claim the win, ask one thing before you reward anyone: can we actually tell who's right, or are we backing the team with the best story?
If you can't tell them apart, you're guessing. You might guess right. But you won't know that you did. You'll fund the wrong lever, scale a campaign that did nothing, and plan next quarter around a win that was never going to repeat. Then when it doesn't, you'll be in the same room again, working out who to blame.
Football has the excuse that it's only a game. Your P&L doesn't.

