

Most business decisions involve many levers. Most causal models get all but one of them wrong
9 Oct 2026


Photo by Georg Eiermann on Unsplash
Most models are built to answer "what's the best way to act on this one lever to change this one outcome in our favour?". This might be the effect of any one of ad budget, capex, price, or any other single lever. But good business decisions don't mean looking at each lever in isolation, one at a time. High-value decisions mean pulling several of those levers together in concert. They don't act in isolation: change the ad budget (lever 1) and the right discount (lever 2) changes too. Deploy capex (lever 1) on a hotel site, and the price (lever 2) has more headroom to change.
Decision-making with data requires causal inference. But the standard approach to causal machine learning (ML) falls apart the moment you're weighing more than one lever at once. Here I'll discuss why, and what our solution is.
Quick recap, because everything below rests on it. There are two fundamentally different jobs we give machine learning, and they only look similar on the surface.
"What will happen if we change nothing?"
Predicting the future of a business left on its current course. It can lean on any pattern in the data: it just has to get the number right. Judged on accuracy.
"What will happen because we act?"
Deciding what to change. You pull a lever and the business responds. Here the model has to tell real cause and effect apart from patterns that merely travel together. Judged on what actually happens after you act.
A model can be superb at the first job and horribly wrong for the second: accuracy tells you nothing about lever quality. For more on that, read Why a highly accurate model can still make terrible decisions.
Which, of course, it does.
The standard approach: how causality usually gets shoehorned into a predictive model
Most modelling projects make no attempt at causality at all, and simply look at accuracy or predictive power. That answers the wrong question and is not about the impact of levers. So any attempt at causal inference should be lauded.
2. Pick the lever you care about and the outcome you care about.
3. Use the diagram to sort every variable into good controls (include them; they block confounding) and bad controls (exclude them; they distort the very effect you're measuring).
4. Fit a predictive model (xgboost, doubleML, whatever) with the lever, the outcome, and only the good controls.
The causal structure every conditioning model implicitly assumes is that every input independently causes the outcome, but that no input causes another input. The structure of conditioning models looks like the causal diagram on the left, while your business problem might look more like the diagram on the right. The structure in the diagram on the right is smuggled into the model on the left by variable inclusion/exclusion alone.
And this works. Until it doesn't.
Used carefully, with one lever, one outcome and one thoughtfully chosen control set, this recipe works. It can sometimes work if multiple lever-outcome pairs share exactly the same conditioning variables. But that's rare and restrictive.
Usually a trap springs when there is more than one lever, which is to say, in pretty much every business case we've worked on.
Businesses don't have one lever. They have a control panel.
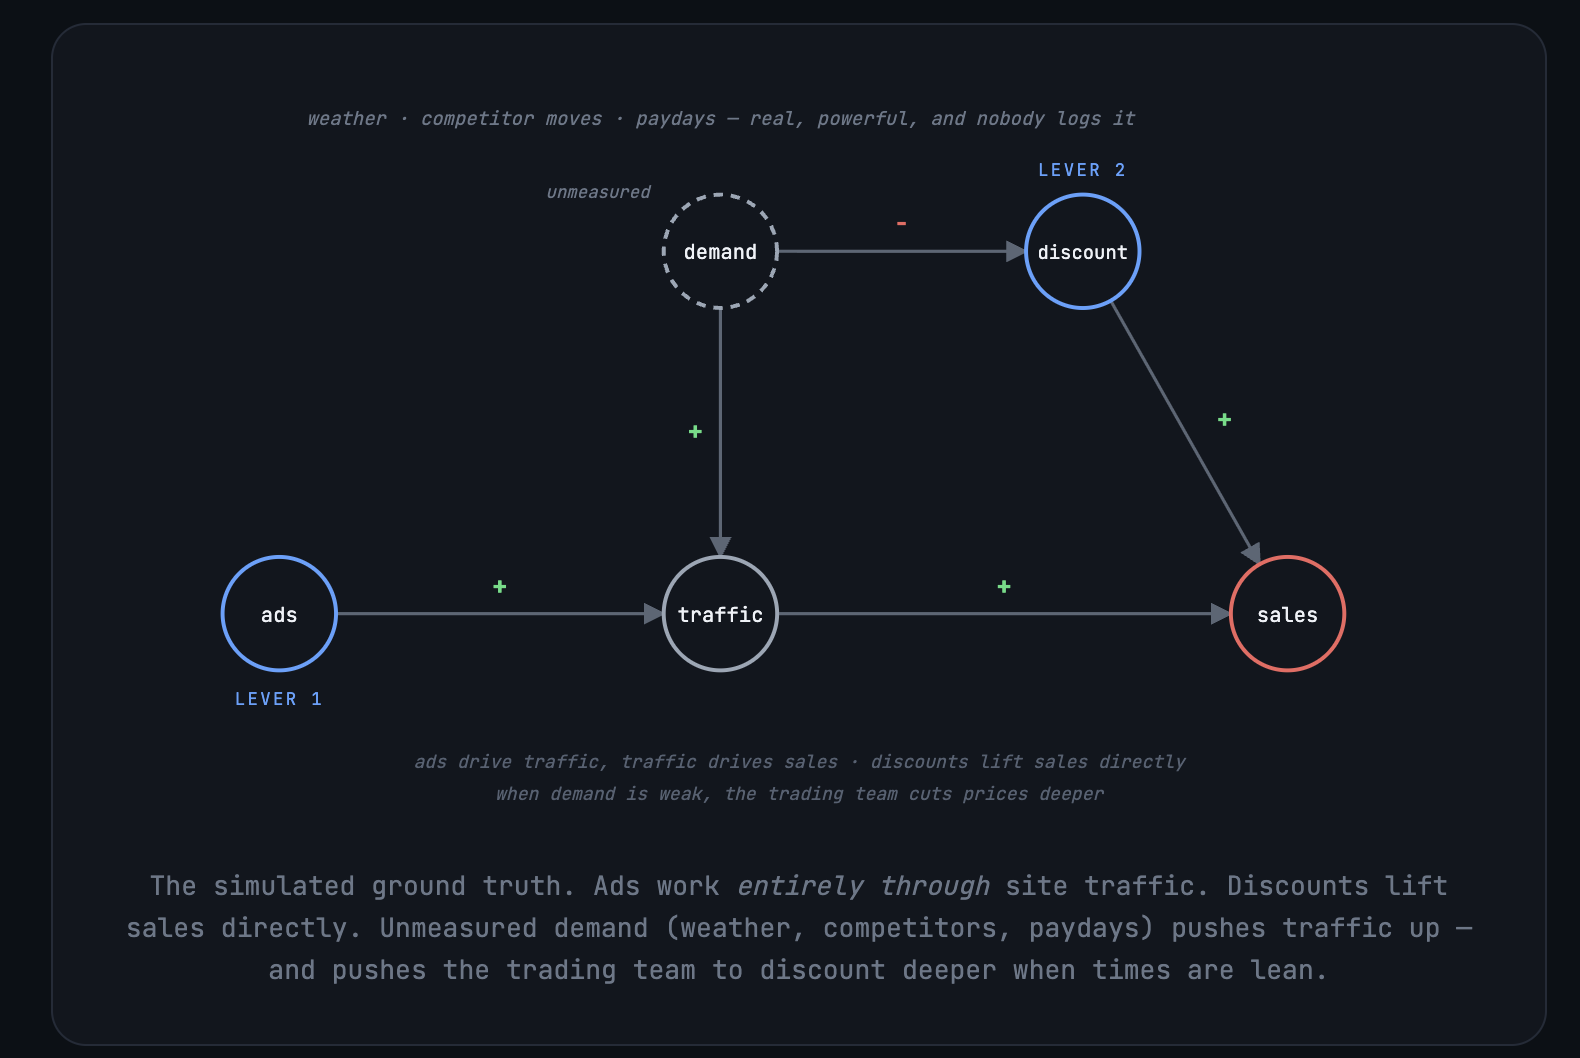
Every arrow here is business-mundane. Ads bring people to the site; people on the site buy things. Discounts convert. And when demand goes soft, any trading team reaches for deeper discounts. That is exactly how weak demand ends up statistically glued to big discounts and low sales. Ads, meanwhile, run on a pre-agreed test calendar, so they move independently of all that.
One model, two levers, one problem
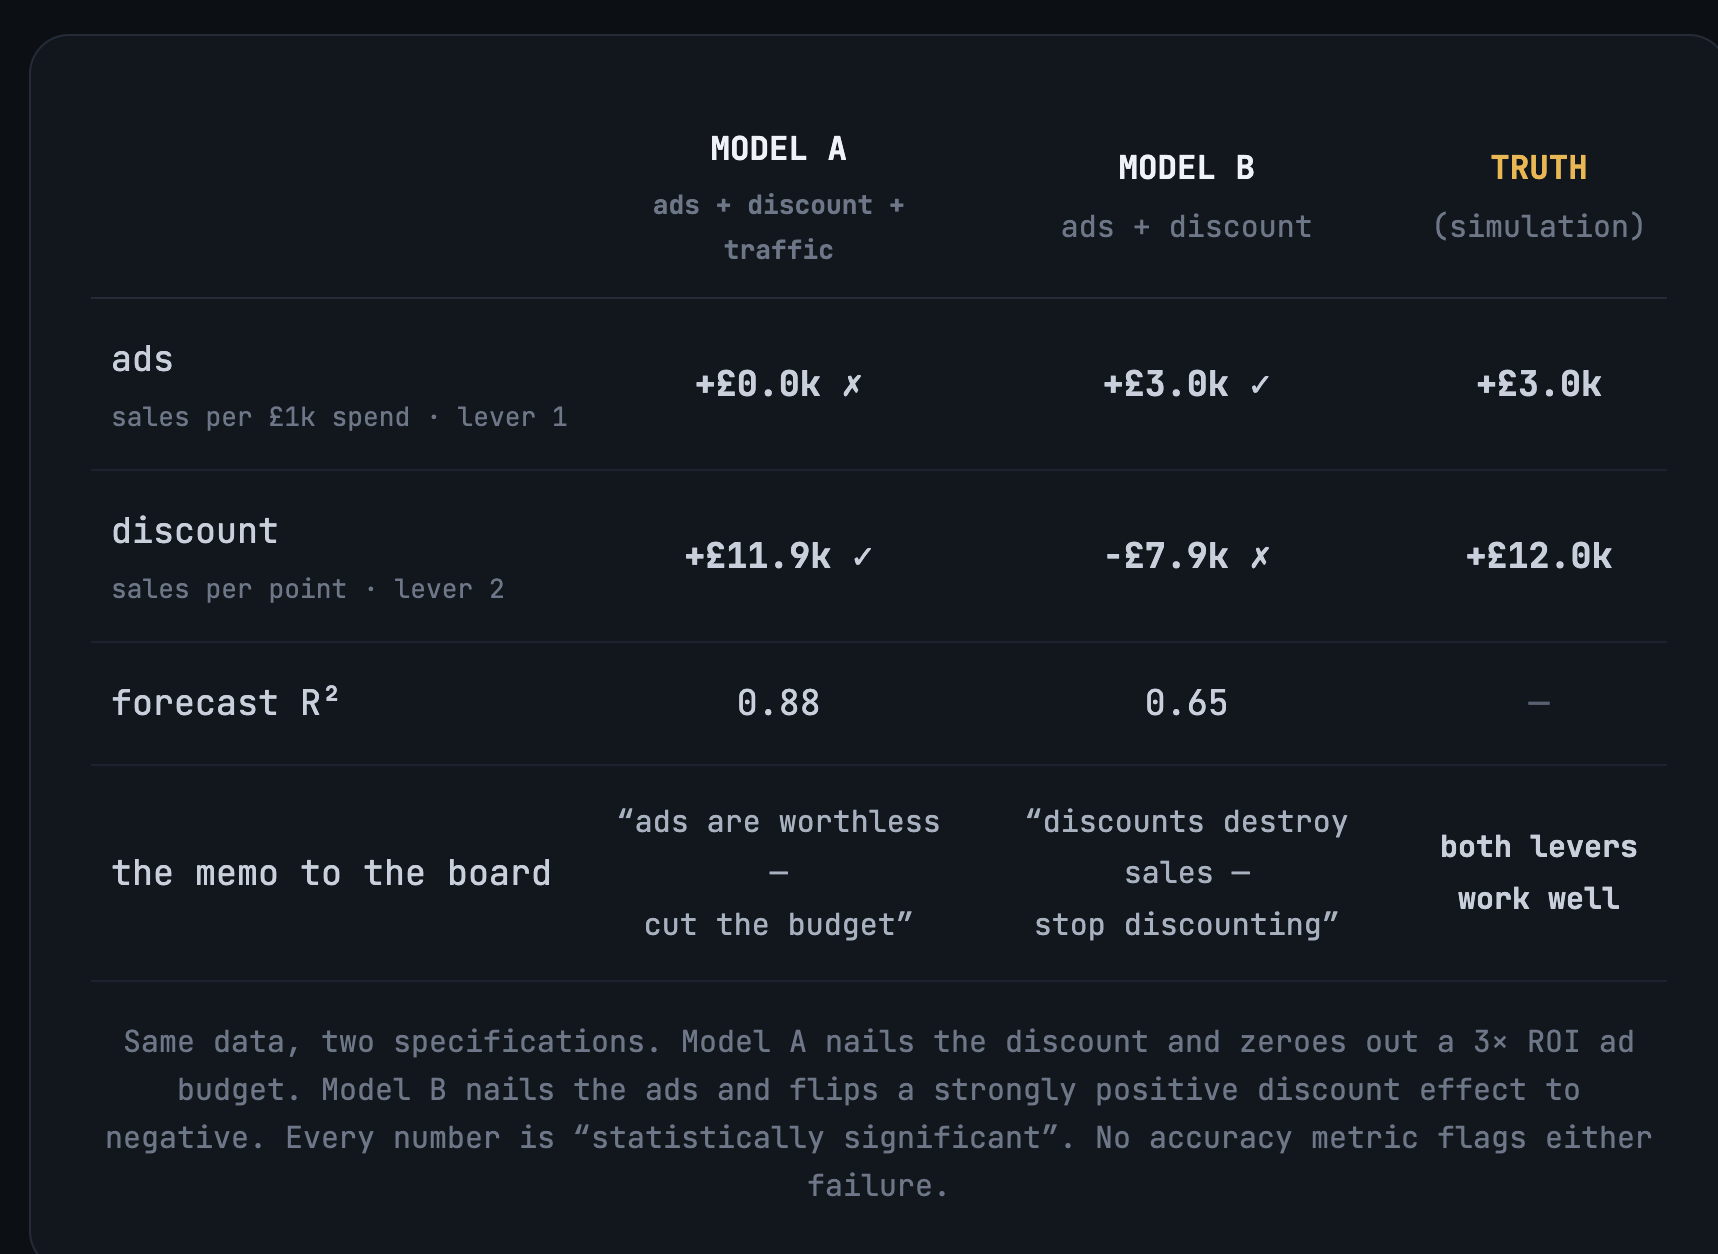
The model that includes traffic (conditions on it) gets the discount decision right but the ads wrong. The model that excludes it gets the discount decision wrong, but the ads right.
The mutual adjustment fallacy: the problem with conditioning models
Why does this happen?
Epidemiologists know the same problem as the Table 2 fallacy (Westreich & Greenland, 2013), after the habit of listing a study's full regression output in Table 2, whereupon readers interpret every row as a causal effect, when the model was at best designed to be causal for one variable.
Scientists make this mistake too
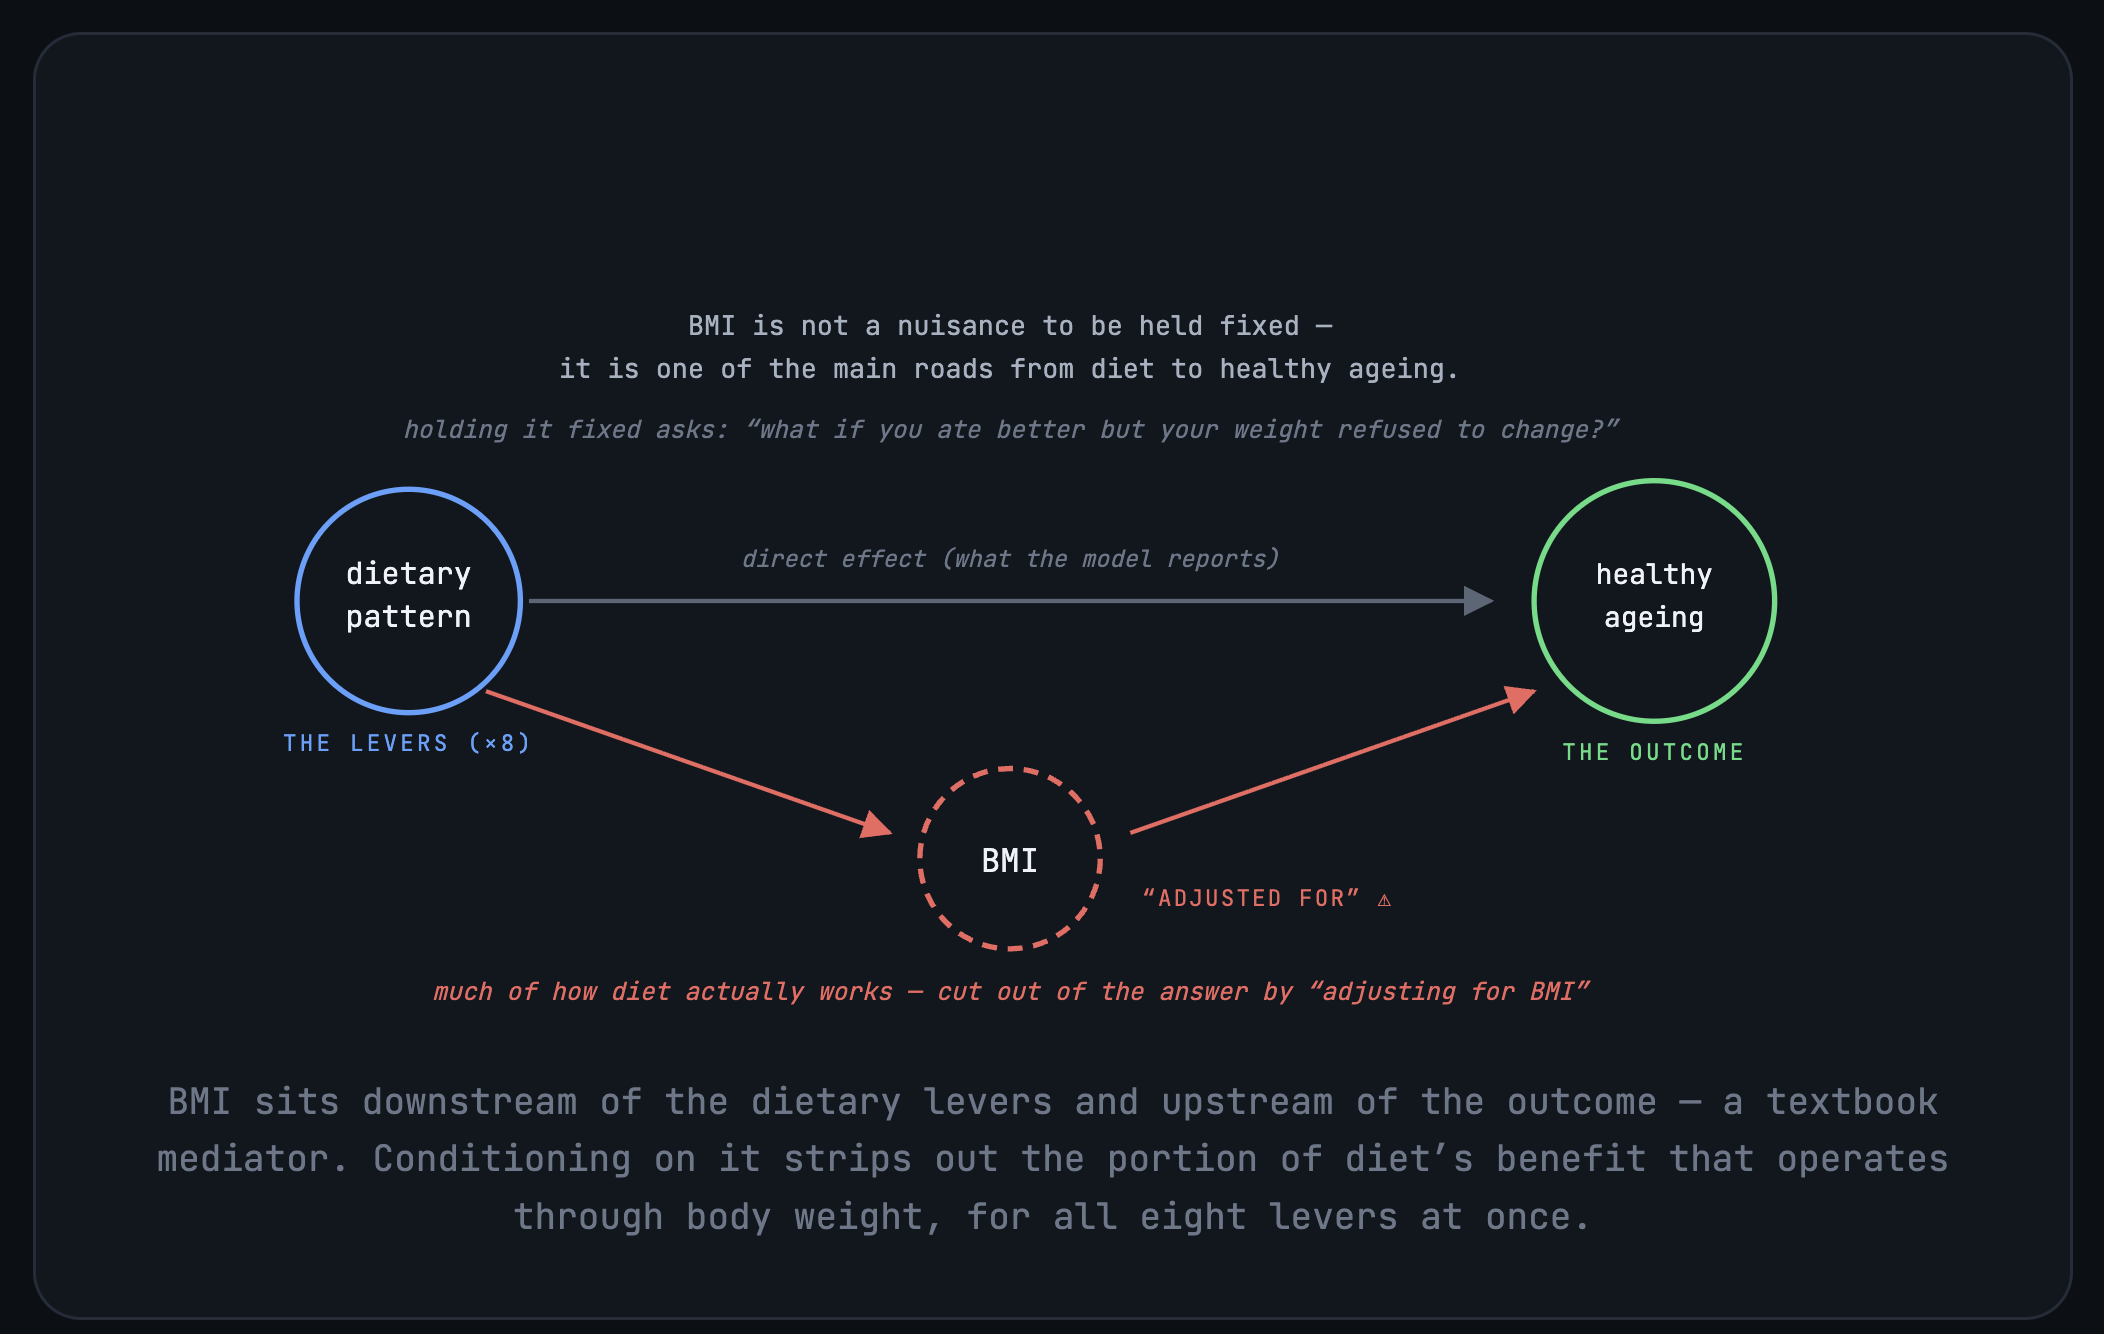
And with eight dietary levers plus dozens of covariates mutually adjusted for one another in one conditioning model, the mutual adjustment fallacy is built into the study design. If it can happen there, with that much scrutiny, it is happening in your quarterly lever-to-KPI analysis.
A workaround hack: one model per lever (and why you'll hate it)
But this doesn't really fix the business problem.
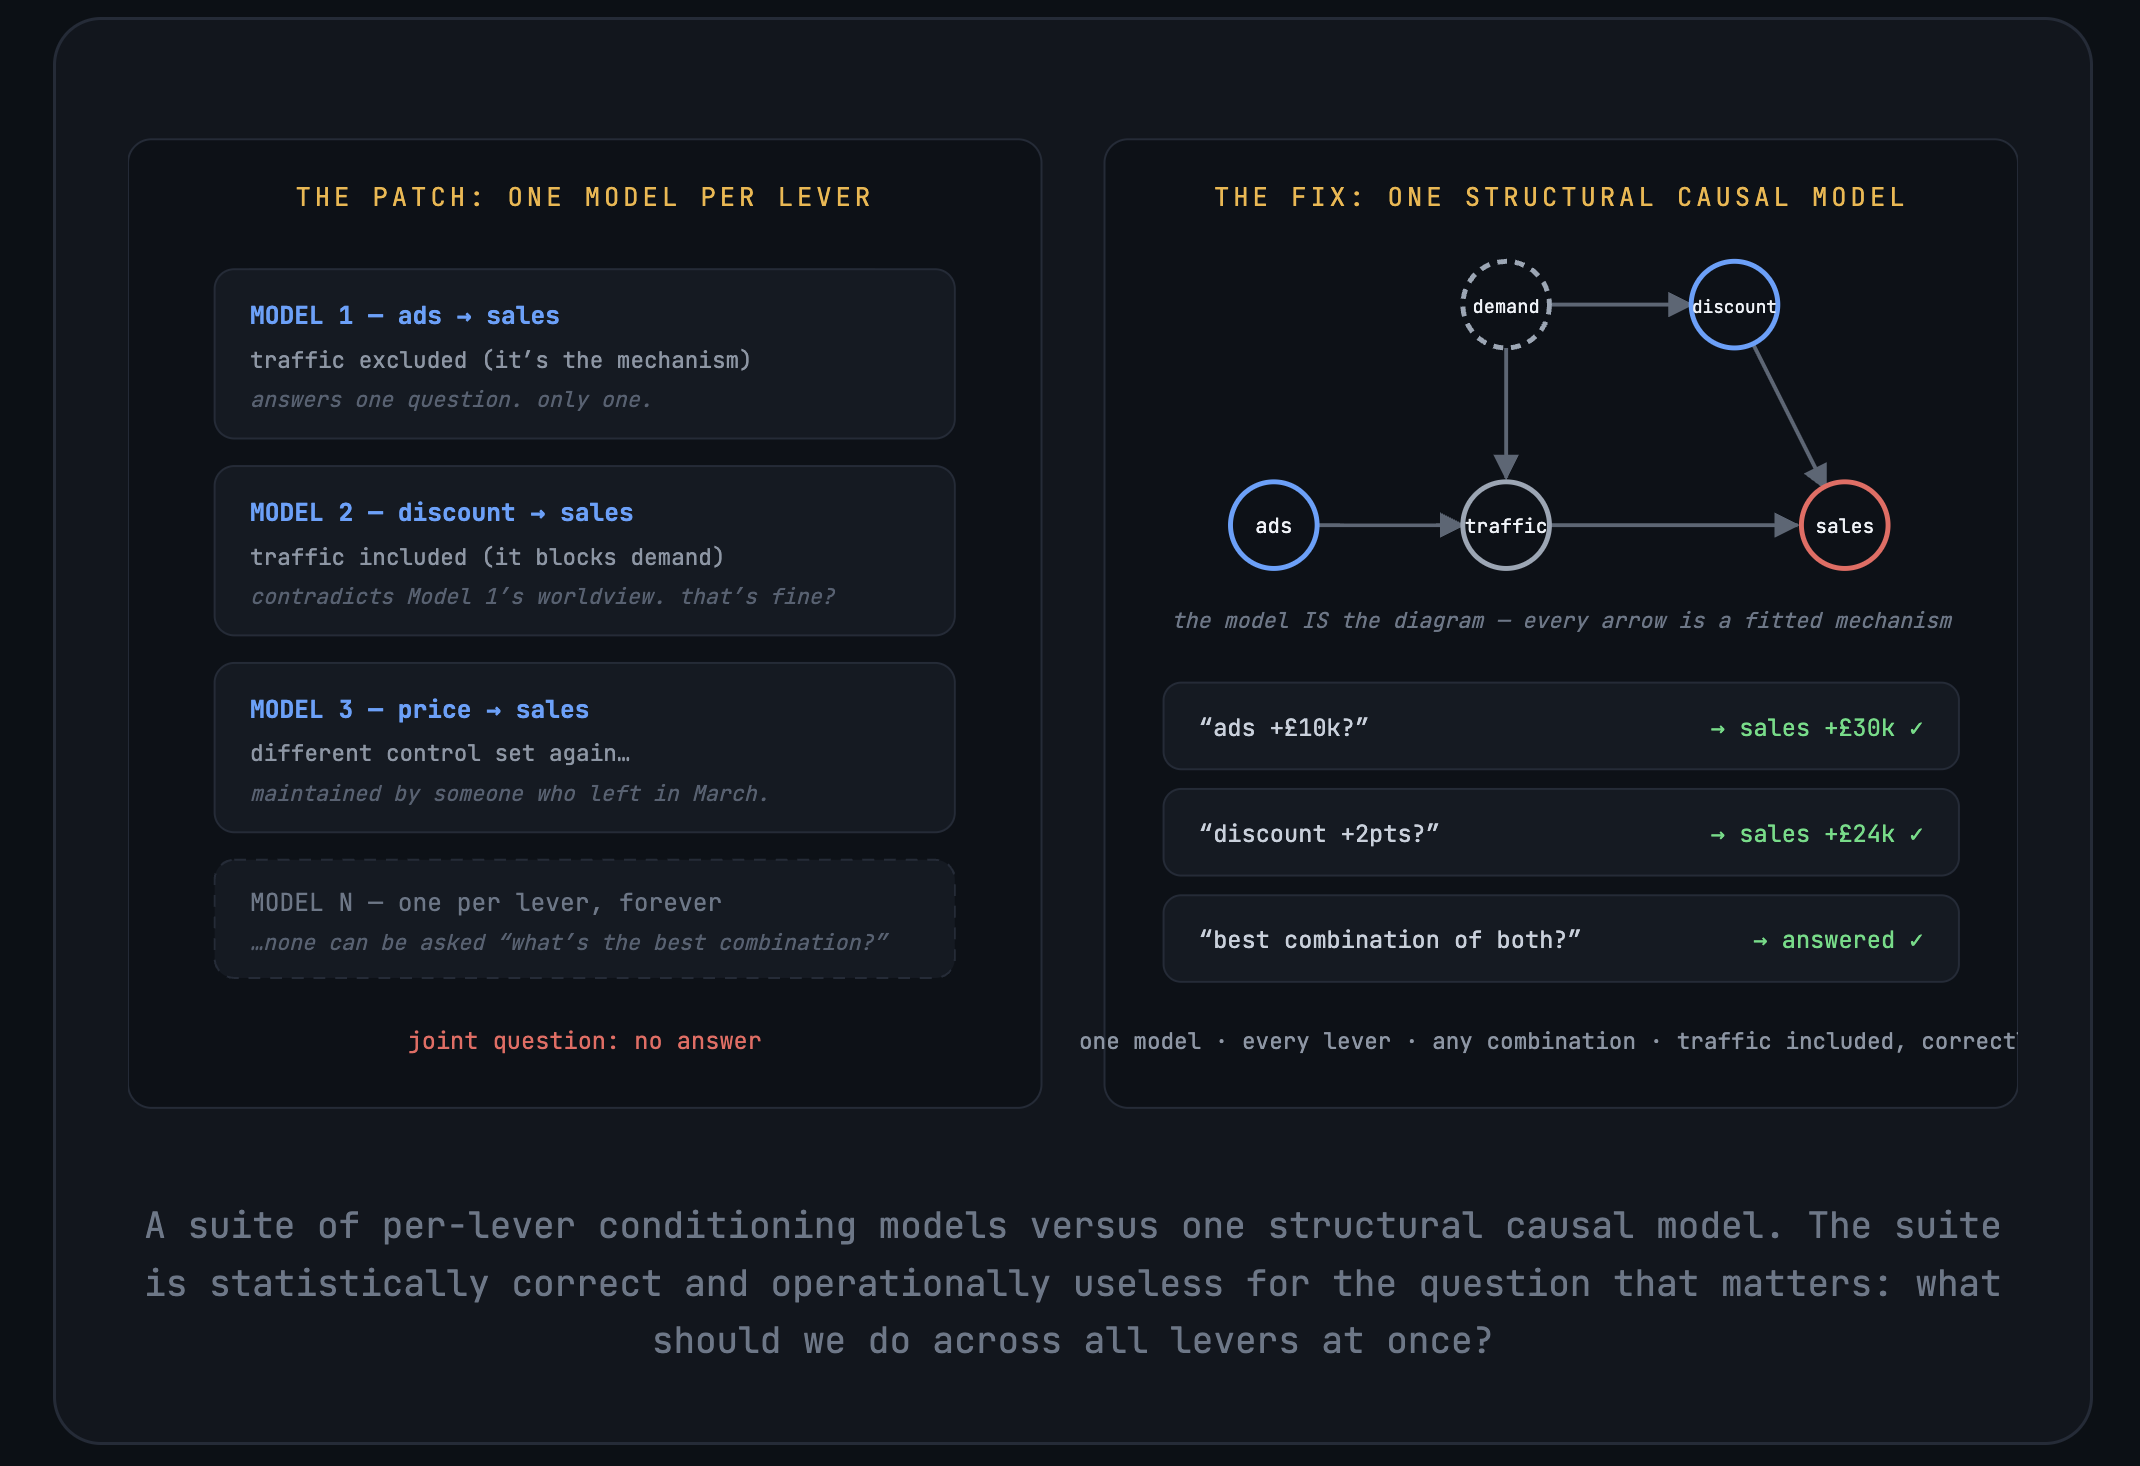
Count the costs of the suite of models. You now maintain N models with N different, mutually contradictory assumptions, each valid only for its own question. Try maintaining and updating that correctly.
The solution: model the structure, not the guest list
The way out is to stop shoehorning causal structure into models that don't represent the causal structure. A structural causal model (SCM, also called a graphical causal model) is the solution.
The SCM explicitly encodes the causal structure, so that the model's architecture and the causal diagram are the same object. It learns the relationships between all variables in the causal diagram for which you allow an arrow. You take the same diagram you were already drawing to classify good and bad controls, and build the model from it instead of using it as an off-model checklist.
The take-aways
- With multiple levers, no single set of controls is always right for all of them. The same variable can be a good control for one lever and a bad control for another, and in a business those variables are everywhere.
- One model per lever fixes the statistics but not the business. The answers don't combine, and the question that matters (what to do across all levers together) goes unanswered.
- A structural causal model fixes the problem. Including a variable no longer means holding it fixed. The old "bad controls" go in and get modelled correctly, and one model answers any lever, in any combination.